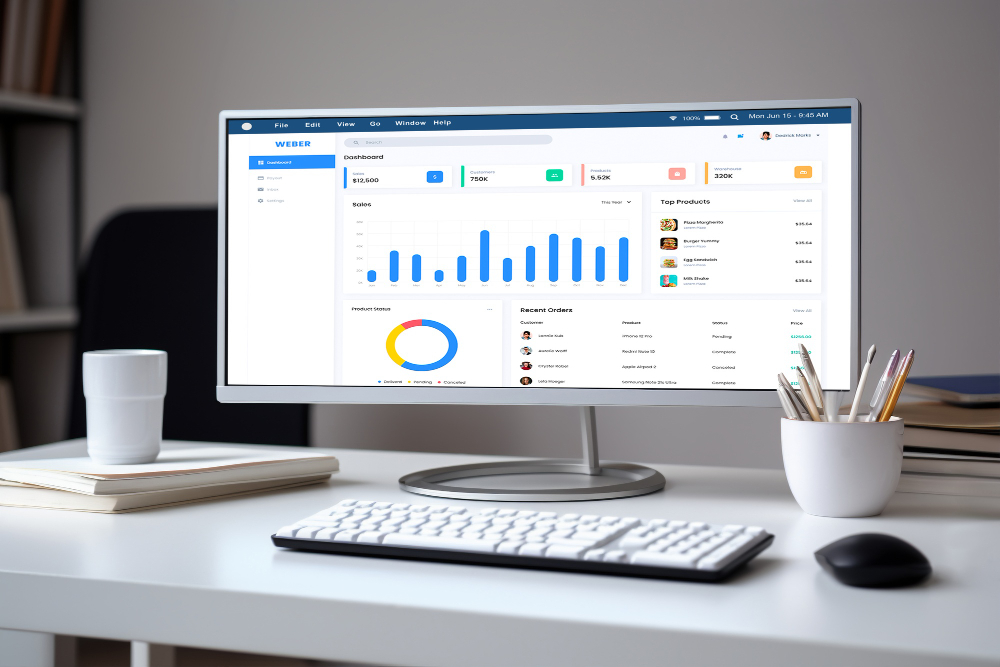
Graphical interfaces displaying at-a-glance key performance indicators allowing the user to drill down and interrogate the detail behind a display have morphed into a new generation of super-control panels. Aggregated granular detail is collated & formatted to be presented in a display which can be interrogated or the data exported for further analysis. LogiCon’s powerful engine can slice and dice data for all types of customizable dashboards.
- Dynamic oversight control (management) tower
- Customized departmental / user consoles
- Hyper-links to deep dive into data detail
- Instant recalibration of any selected graph
- Performance indicators against (variable) targets
- Auto bespoke filters by actionable tagging of any items(s)

Dashboard data can be instantly reconfigured for any period as well as for any geographical area, operation, mode, department, user, client, supplier and so on. Any and all input data can form the basis of a dashboard and report. Further the data can be displayed in any one of numerous graphical, pictorial or text bases and part or all of the data can be selected and be reformatted automatically into sub-displays or form specific reports.
The important inter-relationship between a user and a well presented dynamic graphical display of ‘activity’ is apparent when considering live data is 24/7. A user at a glance at any time of the day has their display blinking their key indicators red, green or whatever colours. We see almost without exception long-standing professional logistics personnel go straight to their ‘dashboards’ as soon as their device is on – morning, noon, night and first thing to do at work and last thing at night. Powerful.
There is not a department in any business, organization or network that would not benefit from a customized dashboard. Finance, marketing, sales, fleet management, warehouse, inventory, shipping, IT, HR … all require a ‘status-report-at-a-glance’. Management has additional high-level control tower displays.
The dashboards LogiCon provides whether standard or customized are ‘live’. Every element of the display is able to be selected and the display will automatically instantly reformat. Select an individual graph or cell block and you can delve into the granular details, eg shipment by shipment, client by client, carrier by carrier, order by order, country by country ….
State-of-the-art visuals capture key performance indicators as they arise. Comparative graphics against targets, historical or other data sets can be displayed. Drill down into the details by any pre-set category such as department, personnel, client, supplier, geo-region and so on. Management oversight on performance at management’s fingertips in their own display.
Powerful predictive reports utilizing aggregated data by any category of data such as by: season, product, region, carrier, retailer or for sales, markets, departments, returns, claims, revenues and so on. Generative AI is adding supplemental inputs to assist refine predictive analysis capabilities and drive innovation to the forefront of businesses.